The I Ching, seasonality and the stock market
Changes are inevitable; however, they always take place within a pattern or seasonality. The I CHING describes this seasonality with the symbol of the TAO. It is circle with an S in the middle representing the two equal yet opposite parts of the ONE. It is said that in the beginning there was ONE and after so many eons it decided to fold itself to become two (Heaven and Earth), and later the two folded themselves to become four and then again folded themselves to become eight (Heaven, Earth, Lake, Mountain, Fire, Water, Thunder and Wind). The lesson is that when you do not know who you are because sometimes you feel as Fire as a father or as Wind as a child or as Mountain as an employee or as Water as a friend, and you feel confused and anxious, just keep in mind that you are ONE, the ALL, the Original. So do not be afraid to feel as any of the eight parts of the TAO because you are subject to seasonality like everything that lives in the TAO. Embrace the seasonality and work diligently but patiently to become a Superior Man, the ONE.
Everything goes through these seasonal cycles including economies, industries and corporations as well as the stock exchange. On one side we have the YANG, which represents the period of positive earnings when the economies, industries and corporations are recovering, experiencing a renewal and a subsequent period of growth. In the case of corporations this is a period when the analysts are continually incrementing its earnings expectations and the corporations continue to meet these earnings expectations. On the other side we have the YIN, which represents the period of a drop in earnings when the economies, industries and corporations experience difficulties. In the case of corporations, this is a period when the analysts continually decrease its earnings expectations and the corporation usually fails to meet these expectations.
Sometimes the cycle can last a few months or sometimes the cycle can last a few years. But regardless of the length of time, the cycles are inevitable. It is up to us as investors, to buy when the corporation is turning around or ending its YIN cycle, to hold the investment all the way and up to the end of the YANG cycle, and to sell it when the corporation is beginning to encounter difficulties and its earnings start to decrease. We must then look for another corporation going through its YIN/YANG cycle.
The stock market is of course also subject to seasonality. Its YANG cycle starts in November and lasts till May when it reaches its highest point of pride, while its YIN cycle starts in June and ends in October when it reaches its lowest point of panic. The concept of “Sell in May and go away” has worked all too frequently. The reason is because the stock market is part of the ALL and as such it is subject to seasonality. We would increase our returns substantially if as investors we follow this simple rule.
Sy Harding, the author of “Riding the Bear”, is one of best students of the seasonality of the markets and he puts out a wonderful letter, advising clients when to buy and when to sell based on this seasonality.
Sy Harding speaks in his book, of the various seasonal tendencies discovered over the years such as:
· “The four year presidential cycle.
· The first halves of months versus the last halves.
· The strong tendency for the seventh and tenth year of each decade to be negative.
· The January effect.
· January as a barometer for the rest of the year.
· September as a reverse barometer for the fourth quarter.
· October’s tendency to produce downside violence.
· The tendency for the “Santa Claus” rally in December.
· The monthly strength period as one month rolls over to the next.
· The positive tendency of monthly options expiration weeks.
· The positive tendency around holidays”.
Mr. Harding makes great emphasis on the idea that fall and winter months are better for investments than the summer months. He also speaks highly of the works of Ned Davis Research, Yale Hirsch and Alan Newman whose studies support the theory that it is best to buy on November 1 and sell on April 30, and stay in cash until the following November 1st. Mr. Harding; however, has improved the theory by using a number of proprietary tools to have even better returns.
David Nichols, another a serious student of seasonality, wrote a wonderful article in 21st Century Alert called Seismic Patterns in which he covers another aspect of the seasonality effect. He compares his studies of the seasonality effect with those of Didier Sornette, a Professor of Geophysics at UCLA, who, as he says: “has used his statistical physics modeling — generally used on earthquakes, and studies of rupture and growth processes in the natural world — and applied them to the financial markets”.
David Nichols says:
“I’ve long been fascinated by the “frequency doubling” evident in the long term chart of the S&P 500 throughout the bear market. Just at an eyeball glance, it’s easy to see that the down and up swings seem to be doubling in length as we progress down the back-slope of the equity bubble.
Here’s what I mean:
Such amplitude waves are not an unusual output pattern for a chaotic, non-linear dynamic system — which the equity markets surely are.
Obviously I’m not the only one who’s been observing this pattern in the stock markets.
Didier Sornette, a Professor of Geophysics at UCLA has used his statistical physics modeling — generally used on earthquakes, and studies of rupture and growth processes in the natural world — and applied them to the financial markets.
His results are fascinating, to say the least.
The Professor, Didier Sornette, and his post-doc research assistants have taken their equations on feedback processes in the natural world, and applied them directly to the S&P 500, to derive a model of its expected future path. These equations describe herding and imitative processes in crowd behavior.
Interestingly, these equations were developed while studying failure mechanisms in materials science. So the way in which cracks and flaws unfold in the natural world is perhaps similar to the way in which information spreads throughout the stock market.
After all, the inputs for the stock market — human perceptions and emotions — are just as natural as the weather, or earthquakes, or other natural dynamic processes. The market can and should be studied like any other natural system. Personally I have been moving down this path of study over the last few years. The market should be studied and analyzed like any other natural, chaotic system.
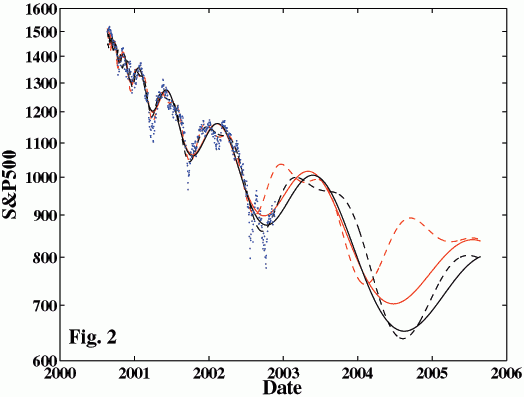
So without further ado, here is Professor Sornette’s prediction for the path of the S&P 500:
The blue dots are the closing prices of the S&P 500 from August 9, 2000 to November 21, 2002. The black line is his physics model of the expected future path as extrapolated from this prior price action. Or, in Professor Sornette’s words, the black continuous line is “the fit and its extrapolation using the super-exponential power-law log-periodic function derived from the first order Landau expansion of the logarithm of the price, while the dashed line is the fit and its extrapolation by including in the function a second log-periodic harmonic.” (Oh…..that’s it …. right…..exactly…)
The red line and its harmonic is the expected path as calculated by the equations as of August 24th. So you can see how this is an adaptive process.
Right now we are on the upswing that should last well into 2003, according to this model. It should go further and last longer than the bears are expecting; essentially, it should end up being roughly two times as long as last year’s rally out of the September lows, and may perhaps carry the SP 500 up towards 1000.
The really interesting part comes after this rally phase, when the model calls for the market to tumble to dramatic new lows well into 2004.
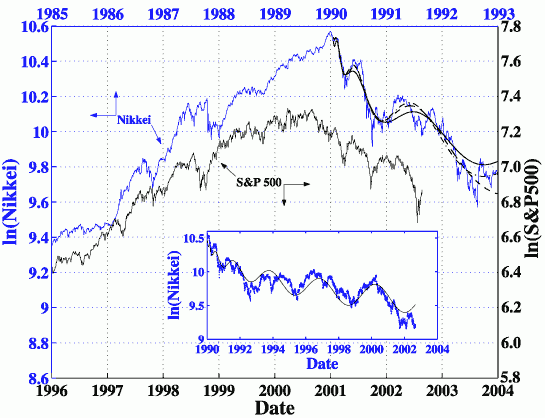
Of course these same equations have been applied to the “poster child” of bubbles, the Nikkei average. Here’s how that looks:
To me, his process and results are not only fascinating, but also make a lot of sense. I think we should keep these forecasts firmly in mind over the next few years. This would be a market path that would fool many people — which is the market’s job — and if the reality comes even remotely close to this model than there will eventually be a massive washout coming for the S&P 500 — to about 650, according to the current projections.
The bears make a great case that we’re not even close to working off the excesses of the bubble, and that this process usually ends in just such massive price destruction, accompanied by investor dread and apathy. I don’t doubt the wisdom in the bear argument, as history usually unfolds in this way — my only problem with the argument is the bears feel that this has to happen right away.
Bear markets are tough on both long and short positions, as we’ve all learned over the past few years. It makes sense that this process should continue for another few years, with the biggest amplitude waves still ahead of us.
Personally, I think this forecast could be a real financial bonanza for us over the next few years. If sentiment and crowd behavior are going to continue to be the dominant market themes, then we should have a real advantage going forward, and should end up making very sizeable profits on this projected path”.


